Plot Numpy Array
Numpy is a powerful library in Python that is widely used for numerical computations. One of the key features of Numpy is its ability to create, manipulate, and plot arrays. In this article, we will explore how to plot Numpy arrays using various plotting functions available in libraries such as Matplotlib and Seaborn.
Importing Required Libraries
Before we start plotting Numpy arrays, we need to import the necessary libraries. Let’s import Numpy and Matplotlib.pyplot for our examples.
import numpy as np
import matplotlib.pyplot as plt
Creating a Simple Numpy Array
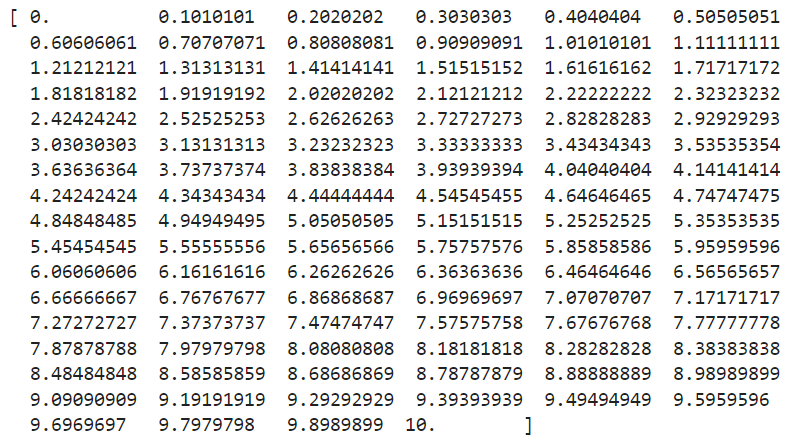
Let’s start by creating a simple Numpy array that we can plot. We will create a one-dimensional array with values ranging from 0 to 10.
import numpy as np
import matplotlib.pyplot as plt

arr = np.linspace(0, 10, 100)
print(arr)
Output:
Plotting a Line Graph
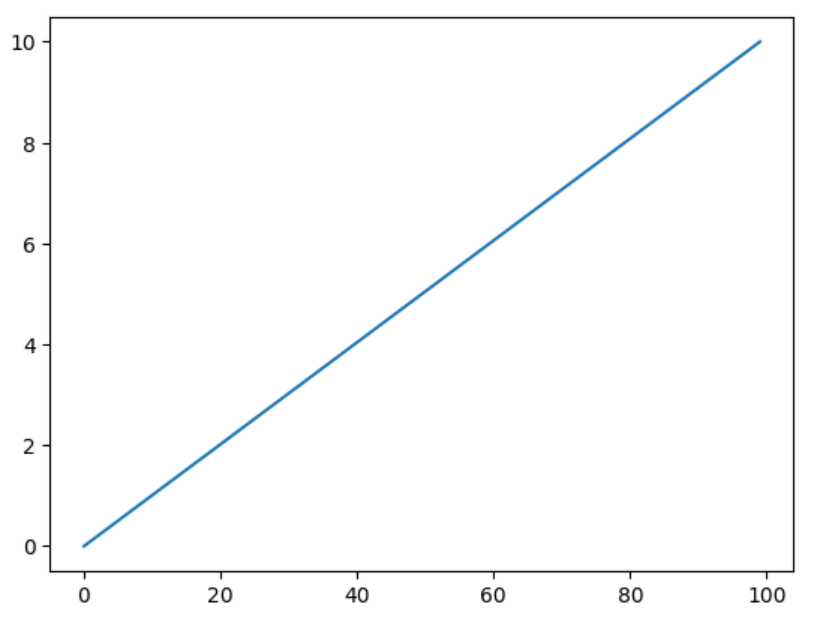
Now, let’s plot the Numpy array arr as a simple line graph using Matplotlib.
import numpy as np
import matplotlib.pyplot as plt

arr = np.linspace(0, 10, 100)

plt.plot(arr)
plt.show()
Output:
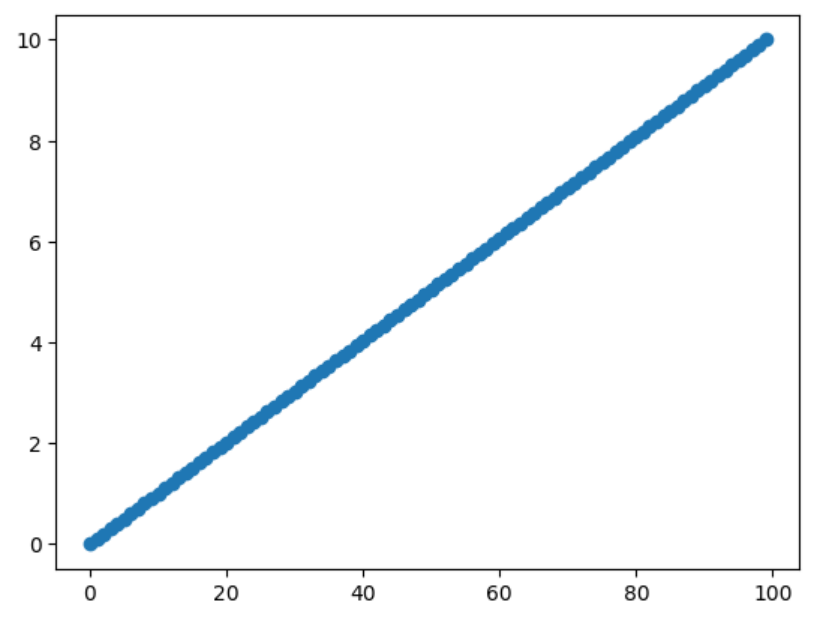
Next, let’s plot the Numpy array arr as a scatter plot.
import numpy as np
import matplotlib.pyplot as plt

arr = np.linspace(0, 10, 100)

plt.scatter(range(len(arr)), arr)
plt.show()
Output:
Plotting a Histogram
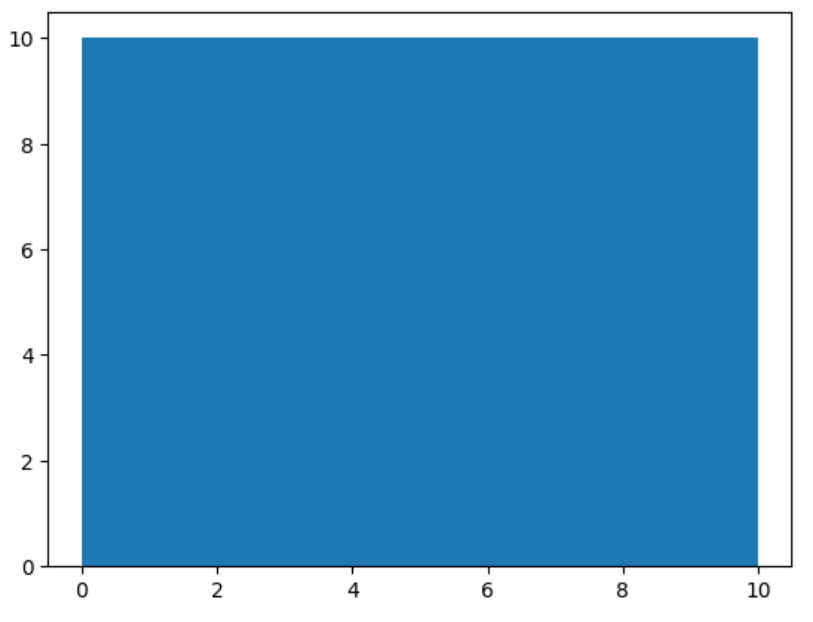
We can also plot a histogram of the Numpy array arr using Matplotlib.
import numpy as np
import matplotlib.pyplot as plt

arr = np.linspace(0, 10, 100)

plt.hist(arr, bins=10)
plt.show()
Output:
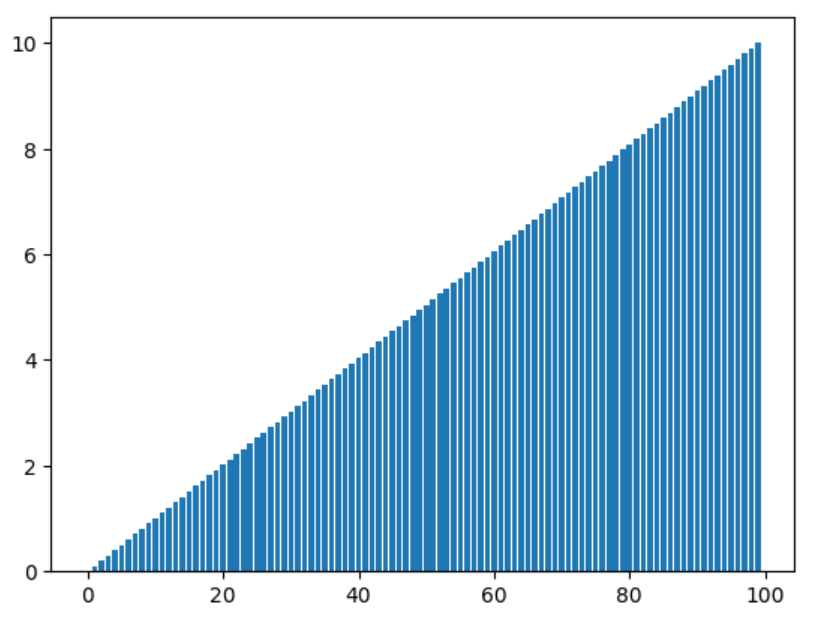
Plotting a Bar Graph
To plot a bar graph of the Numpy array arr, we can use Matplotlib as well.
import numpy as np
import matplotlib.pyplot as plt

arr = np.linspace(0, 10, 100)

plt.bar(range(len(arr)), arr)
plt.show()
Output:
Plotting a Heatmap
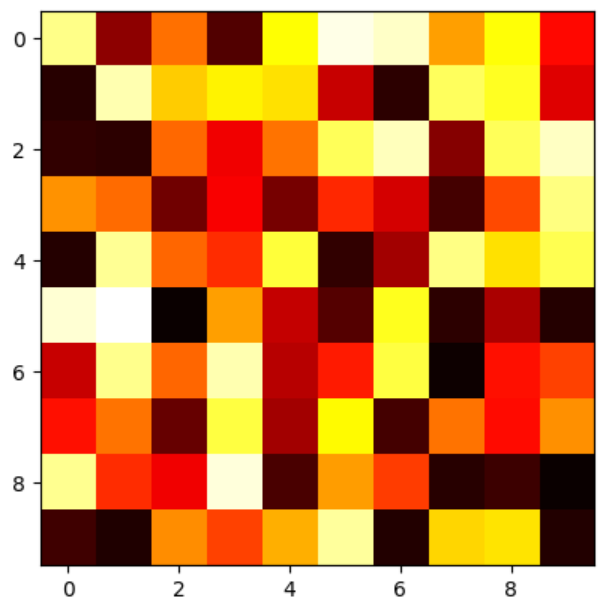
If you have a two-dimensional Numpy array, you can plot it as a heatmap using Matplotlib.
import numpy as np
import matplotlib.pyplot as plt

arr = np.linspace(0, 10, 100)

arr_2d = np.random.rand(10, 10)
plt.imshow(arr_2d, cmap='hot', interpolation='nearest')
plt.show()
Output:
Plotting a 3D Surface Plot
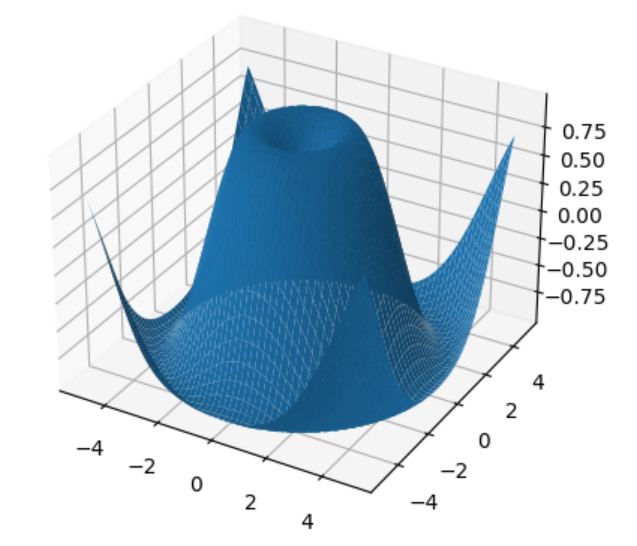
To plot a Numpy array as a 3D surface plot, we can use Matplotlib’s plot_surface function.
import numpy as np
import matplotlib.pyplot as plt

arr = np.linspace(0, 10, 100)

x = np.linspace(-5, 5, 100)
y = np.linspace(-5, 5, 100)
X, Y = np.meshgrid(x, y)
Z = np.sin(np.sqrt(X**2 + Y**2))

fig = plt.figure()
ax = fig.add_subplot(111, projection='3d')
ax.plot_surface(X, Y, Z)
plt.show()
Output:
Plotting Multiple Lines
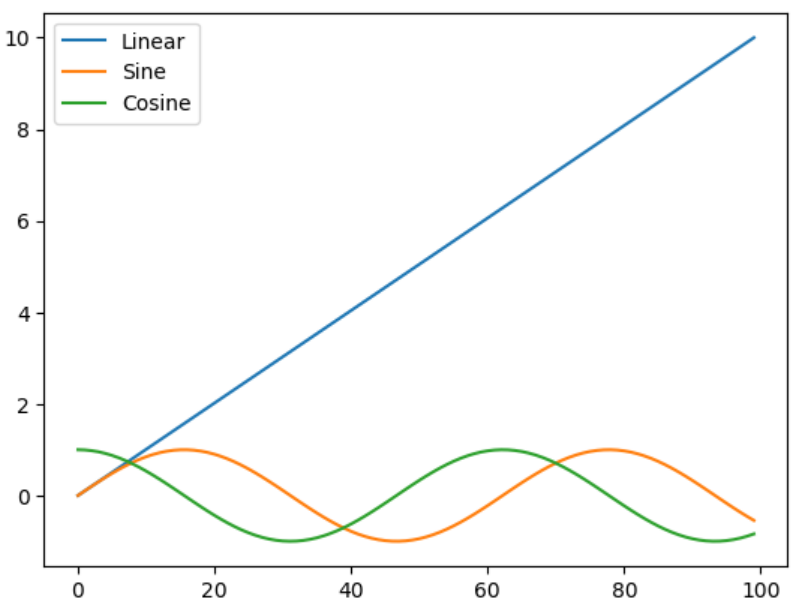
You can also plot multiple lines on the same graph by passing multiple Numpy arrays to the plot function.
import numpy as np
import matplotlib.pyplot as plt

arr1 = np.linspace(0, 10, 100)
arr2 = np.sin(arr1)
arr3 = np.cos(arr1)

plt.plot(arr1, label='Linear')
plt.plot(arr2, label='Sine')
plt.plot(arr3, label='Cosine')
plt.legend()
plt.show()
Output:
Customizing Plots
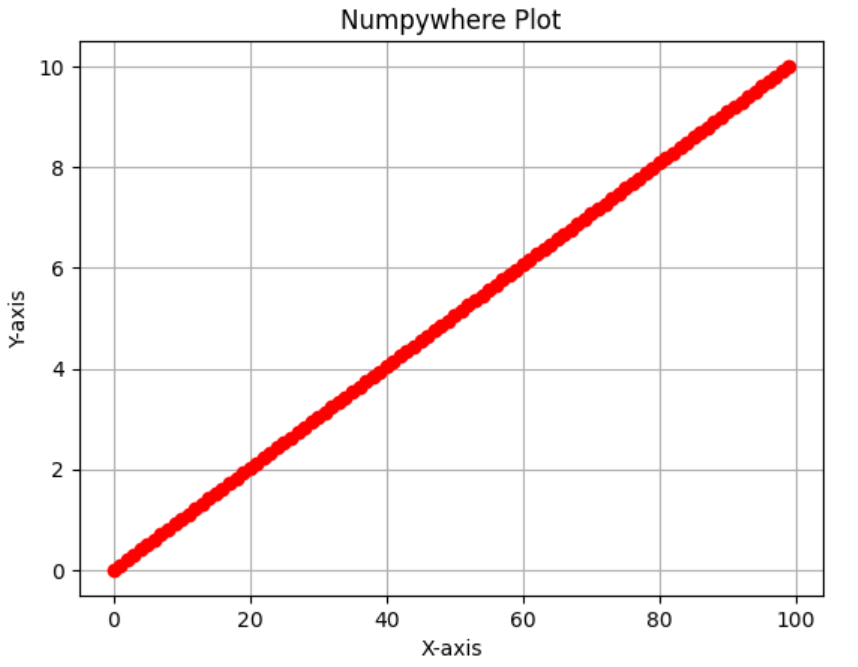
Matplotlib provides a wide range of customization options to enhance your plots. You can adjust the colors, labels, titles, axis scales, and more.
import numpy as np
import matplotlib.pyplot as plt

arr = np.linspace(0, 10, 100)

plt.plot(arr, color='red', linestyle='--', marker='o')
plt.xlabel('X-axis')
plt.ylabel('Y-axis')
plt.title('Numpywhere Plot')
plt.grid(True)

plt.show()
Output:
Conclusion of plot numpy array
In conclusion, plotting Numpy arrays is a powerful way to visualize data and gain insights from it. By using libraries like Matplotlib, you can create a wide variety of plots to suit your needs. Experiment with different plot types, customization options, and data sets to explore the full potential of Numpy array plotting.
 NumpyWhere